
Earthquake sensors can tell the difference between tremors and sonic booms from space debris
Not all rumbles beneath our feet come from shifting tectonic plates. Seismologists have learned to identify sonic booms from falling space debris using earthquake sensors designed to detect subtle ground vibrations. By analyzing signal patterns, wave frequencies, infrasound, and arrival times, experts can distinguish artificial atmospheric disturbances from natural seismic events.
When combined with satellite data and atmospheric readings, these tools offer a sophisticated way to trace ripples from the upper atmosphere all the way to the ground.
1. Analyze sound wave frequencies to distinguish explosions from impacts.

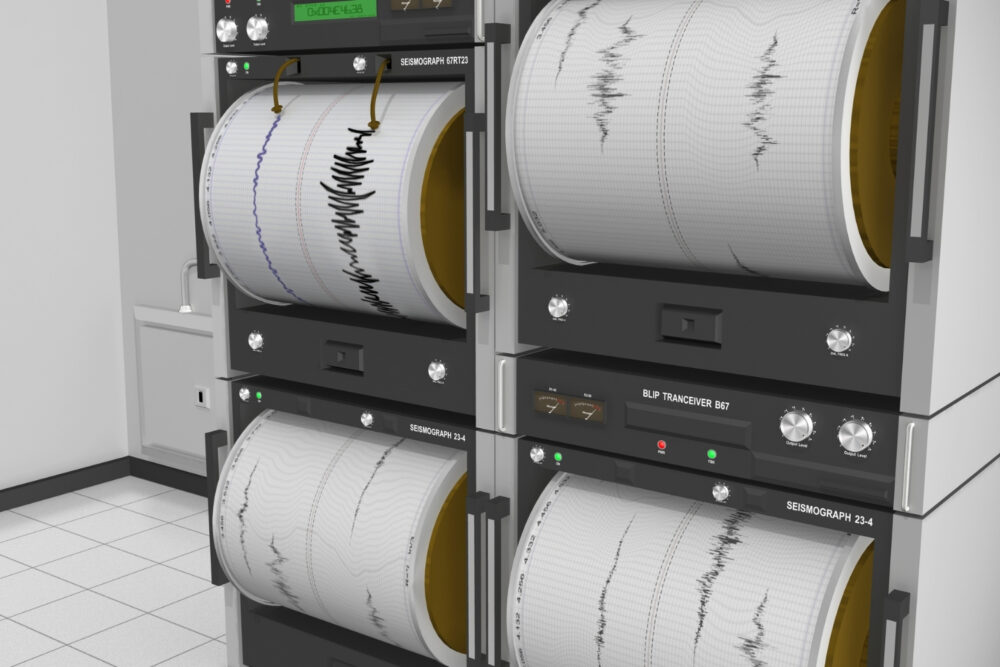
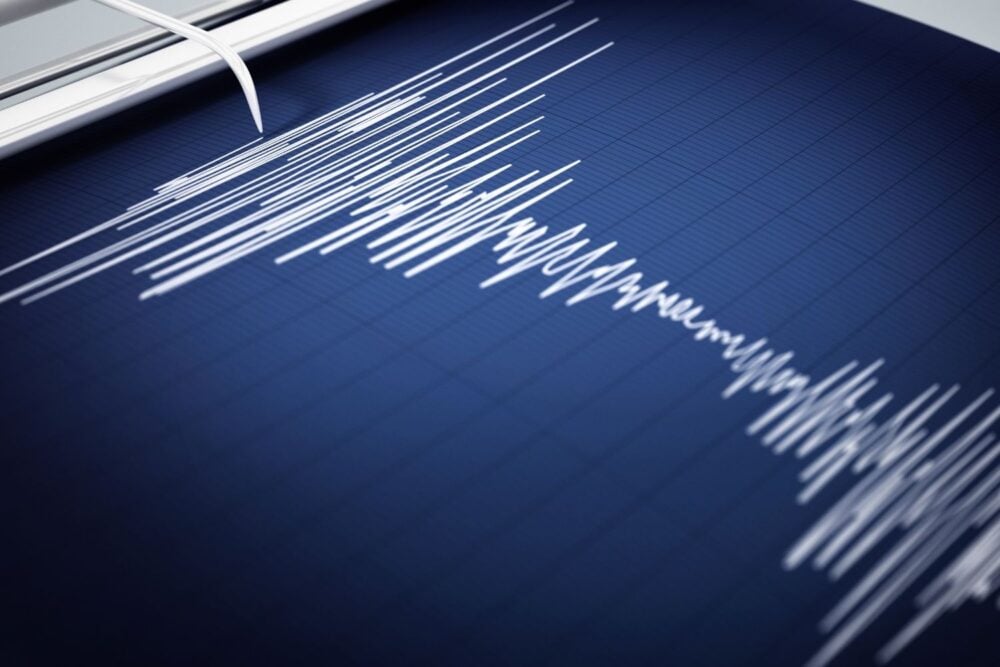
Explosive events, like space debris reentry or man-made detonations, release acoustic energy that earthquake sensors can detect. The frequency of these sound waves differs from tectonic tremors. High-frequency waves usually point to fast, sharp impacts, while low-frequency waves signal deeper, slower processes underground.
Seismologists compare these frequencies to a growing database of known events. Sonic booms from above create distinct, rapid-onset spikes, unlike the layered ripple of an earthquake. A metal fragment slicing through the stratosphere at supersonic speed generates waveforms more like a jet breaking the sound barrier than shifting rock plates.
2. Measure signal duration to separate lightning strikes from tremors.

Lightning strikes send a quick jolt through the ground, generating seismic signals that last only a few seconds. In contrast, tremors from tectonic activity tend to unfold over longer periods as stress release spreads through layers of earth. Duration becomes a key identifier.
Most sensors logged near-instant pulses when a storm rolled through west Texas, unlike the swelling motion seen just days earlier during a minor quake. An impact may be dramatic, but its brevity sets it apart. Analysts rely on signal length to help filter false alarms from more sustained seismic events.
3. Track arrival times of seismic waves for pattern recognition.
Seismic waves travel at known speeds through different materials, allowing sensors to track their arrival times across various locations. By noting when waves hit each station, scientists can map the event’s origin—a technique called triangulation. Consistent arrival patterns signal earthquakes, while erratic ones suggest something else.
One sonic boom reached stations unevenly, hitting ridgeline sensors before lowland ones despite shorter physical distances. That timing pointed to a high-altitude atmospheric source. Mapping these wave paths builds a picture not just of location, but also of the vertical layer where the disturbance began.
4. Use atmospheric pressure readings to identify sonic boom signatures.

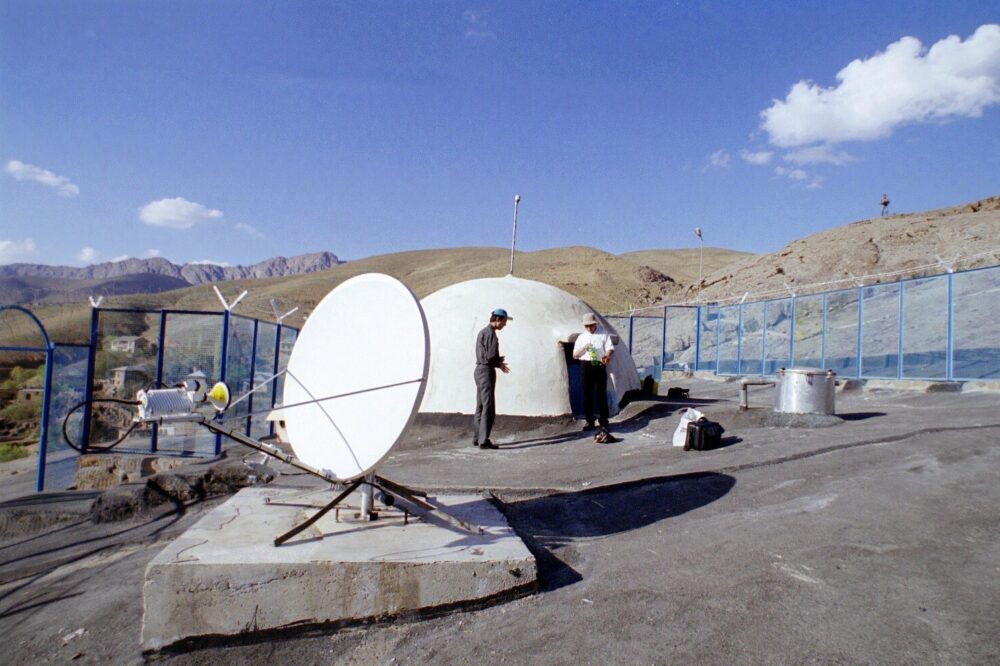
Sudden shifts in air pressure, recorded by specialized barometers, often accompany sonic booms from space debris. These pressure waves travel faster than ground vibrations and can reach monitoring devices seconds ahead of a seismic signature. Their shape and timing provide vital atmospheric context.
When a sonic boom shook windows in Manitoba, nearby pressure sensors had already picked up an abrupt spike. That clue, paired with seismic data and timing, suggested an overhead atmospheric origin—not a ground-based event. The dual detection narrowed possibilities before satellite confirmation came in.
5. Compare vibration intensity across multiple stations to confirm origin.
A single seismic station can’t always tell the whole story. But when multiple sensors pick up increases in vibration intensity, analysts can compare data across distances. Uniform strength often hints at deep earthquakes, while localized peaks might mark surface impacts or atmospheric events.
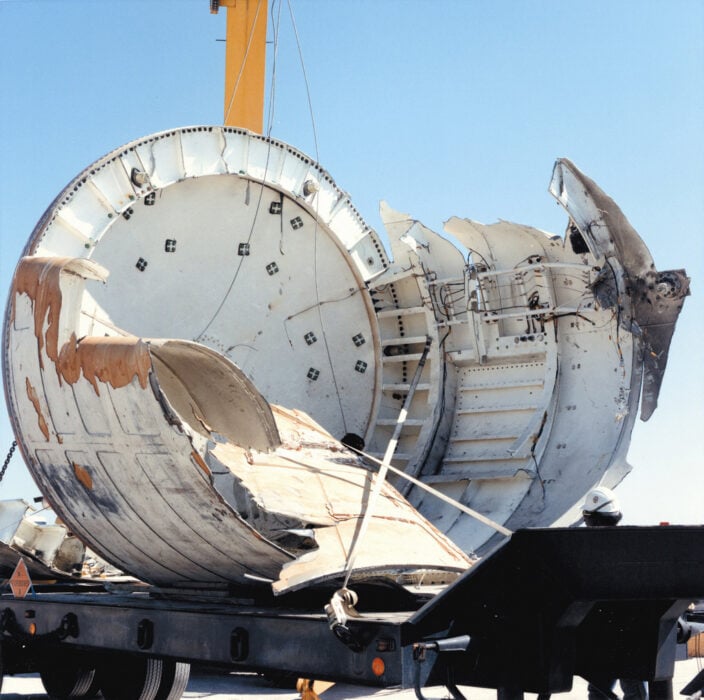
During the reentry of a defunct satellite, three stations recorded sharp, uneven jolts—strong in one valley, faint in another. Those inconsistencies didn’t align with tectonic models but did match a sonic boom’s footprint. Spatial comparison showed that the cause came from above, not below.
6. Filter data with algorithms that flag known rocket reentry profiles.
Sophisticated algorithms sift through seismic data, flagging patterns that resemble historical rocket reentries. These filters aren’t flawless, but they reduce false matches by comparing current readings against known vehicle trajectories, acoustic footprints, and expected ground signatures.
One alert matched the vibrational curve of a retired weather satellite’s fall, prompting a deeper review. On closer analysis, timing, waveform shape, and ancillary data confirmed the identification. Without algorithmic pre-screening, such overlaps with past entries would be harder to catch in time.
7. Cross-check seismic activity with weather radar to rule out storms.
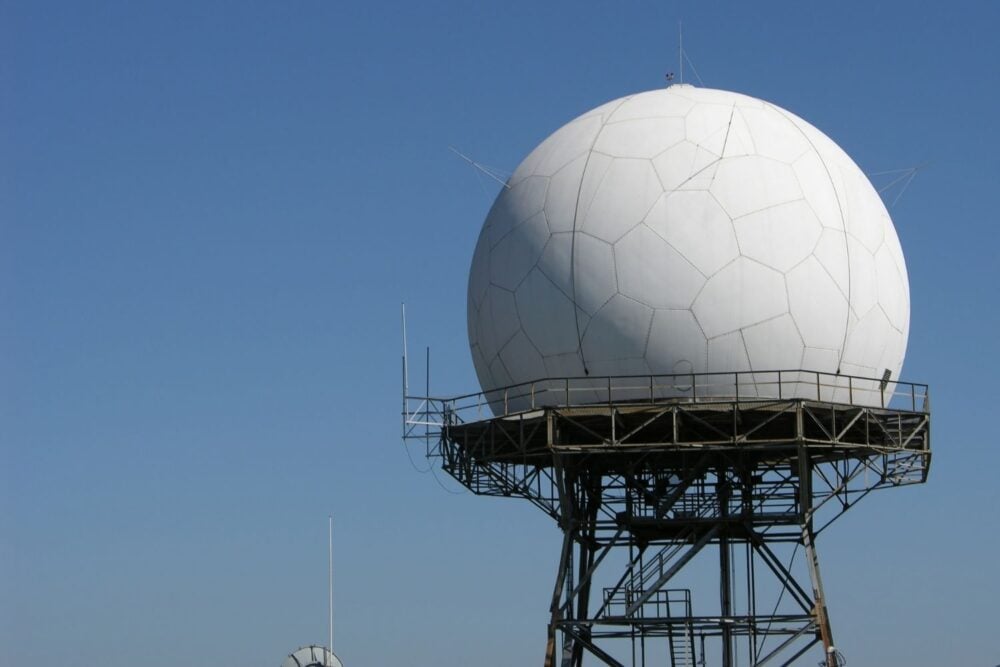
Weather radar typically tracks atmospheric movement, but it also helps eliminate common sources of loud pressure waves. If a strong seismic signature lacks matching radar echoes, storms can be ruled out, shifting focus toward mechanical or extraterrestrial sources like debris or launches.
A sonic boom over a clear stretch of Nevada once puzzled locals until radar logs showed no storm cell or lightning event within 300 miles. That absence closed one possibility, steering investigators toward footage of a fast-moving plume—ultimately traced to a falling fuel tank.
8. Examine depth of signal source to tell natural from artificial events.
The depth of a signal’s origin hints at its cause. Earthquakes begin below the surface, often miles down, while sonic events occur at or above ground level. Sensors gauge this by analyzing wave dispersion and vertical directionality.
After odd tremors rattled a desert town, data revealed an unusually shallow source—less than 500 feet beneath sensors, inconsistent with a quake. Coupled with an upward-trending wavefront, signs pointed skyward. The source: a disintegrating booster breaking apart over the basin.
9. Match waveform shapes to a library of known seismic patterns.
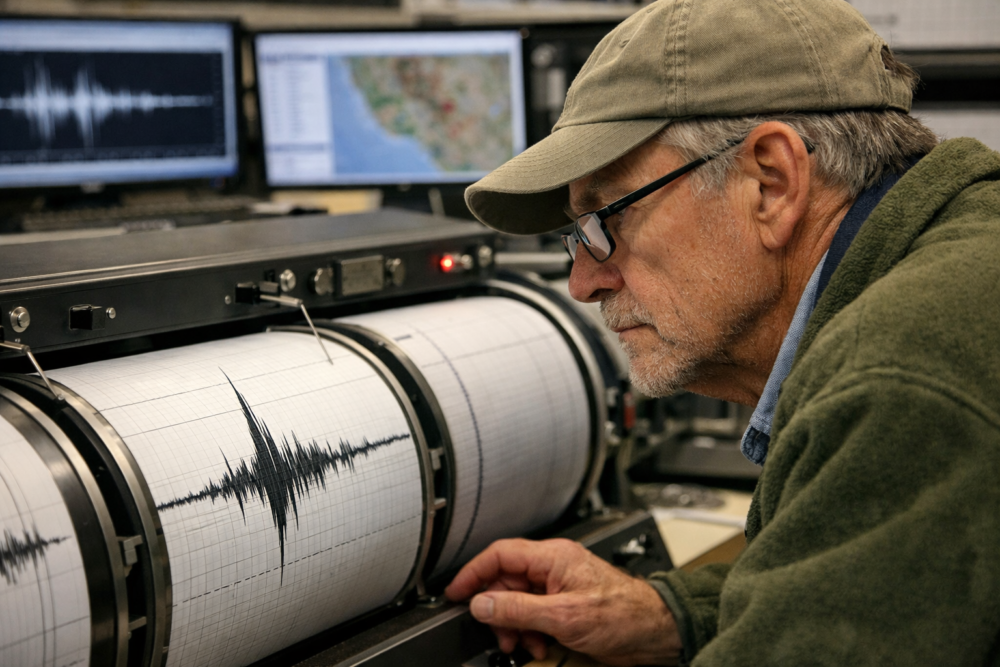
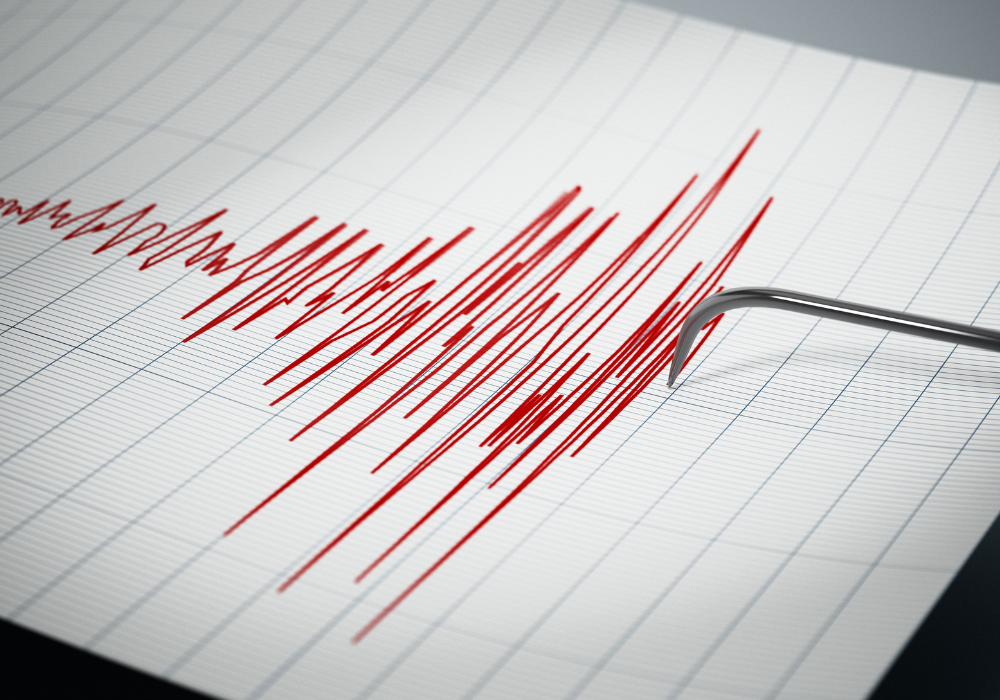
Waveform shapes act like signatures. Certain curves belong to natural earthquakes—a gradual build, a central peak, a tapering release. Sonic booms, by contrast, tend to spike abruptly with clean edges. Seismologists match these forms to a digital catalog of known events.
When a mystery pulse hit midwestern sensors, its waveform lacked the rounded volatility of fault slippage. Instead, it mirrored the chiseled arc of a prior debris-related boom recorded in Montana. That rhyme helped teams rule out tectonic causes with quiet confidence.
10. Monitor infrasound alongside ground movement for more accurate detection.
Ground movement alone can mislead. That’s why many seismic stations pair with infrasound microphones that detect low-frequency acoustic waves from the sky. These signals travel slowly but carry vital detail about events high above Earth’s surface.
Following a nighttime boom, seismometers recorded subtle tremors too shallow for a quake. Simultaneously, infrasound sensors traced long-wavelength pulses sweeping across open plains. Their combined profile narrowed the source to incoming debris, likely tumbling through high atmosphere before shattering audibly over farmland.
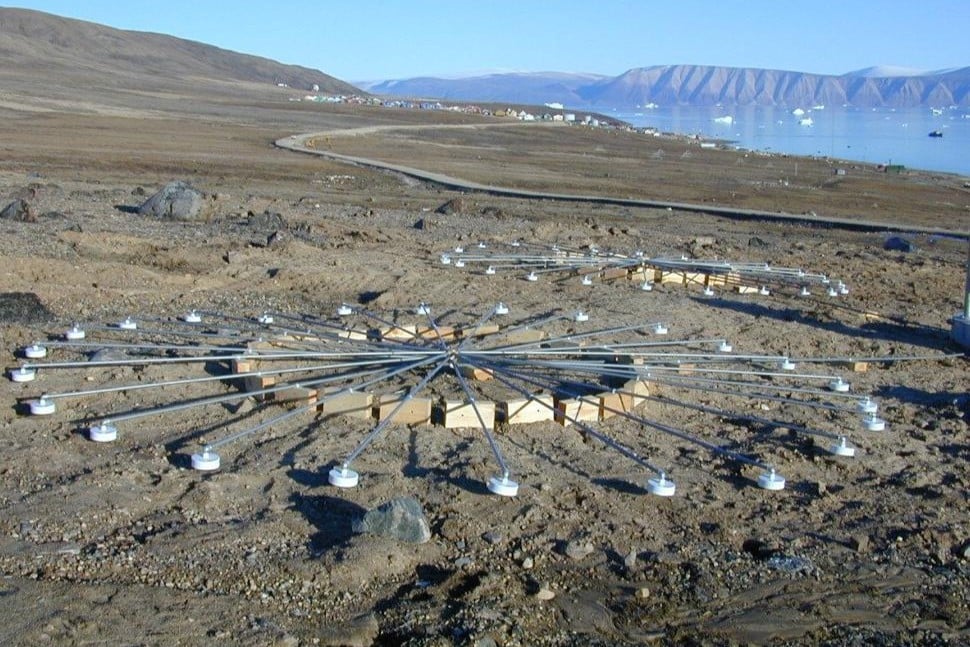
11. Isolate high-altitude acoustic signals to spot space debris entries.

High-altitude acoustic waves arrive scattered and elongated, distinct from crisp low-level impacts. Isolating them requires tuned infrasound arrays positioned far apart, able to detect subtle shifts in air density and sonic ripple caused by space debris passing through thin upper layers.
One such event left no visible trace on the surface, but microphones across three counties logged the same faint whoosh with a telltale pulse spacing. Together, their readings pointed to a piece of orbital junk skipping across the stratosphere like a flat stone over water.
12. Combine satellite data with ground reports to confirm sonic sources.

Satellites provide overhead imaging and trajectory data, while ground stations capture pressure, motion, and acoustic effects. When both streams align—say, a visible fireball matching seismic timestamps—researchers can confirm a sonic source with high precision.
In one case, a European satellite spotted fragments entering the atmosphere within a narrow window. Minutes later, sensors across northern Canada picked up compatible tremors. The timecode match tied sky to soil, stitching an invisible path into a documented object reentry.